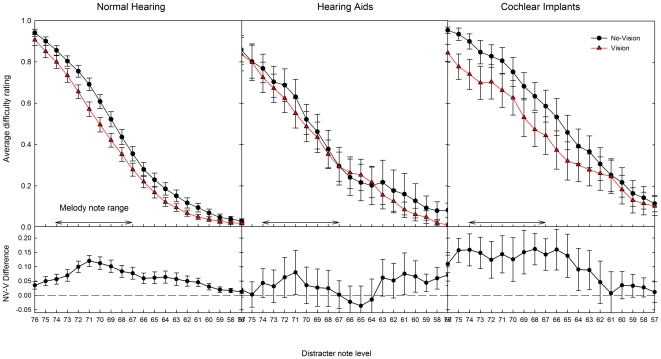
Figure 5. Difficulty ratings across distracter note levels.
Top panel: Difficulty ratings (+/- SEM), averaged across INC and DEC blocks, as a function of distracter note level, with visual cues provided (red triangles) and with no visual cues (black squares). Bottom panel: the reduction in difficulty provided by the visual cue.

