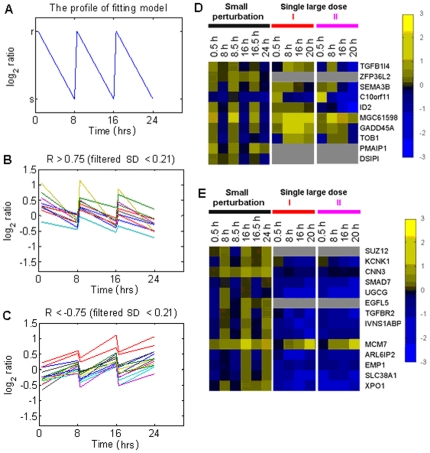
Figure 2. Results of steady-state model-fitting algorithm and the corresponding expression profiles of single large dose treatments.
A) The profile of the fitting model. r and s are both arbitrary constants. Only genes with profiles of gene expression which changes significantly over time points (SD >0.21) were applied model-fitting algorithm. B and C) The expression profiles of genes with correlation coefficient, R, more than 0.75 (positive correlation) and less than −0.75 (negative correlation), respectively. Genes with correlation coefficient absolute value, |R|, greater than 0.75, as shown in (B) and (C) were considered to have a steady-state response. D and E) Steady-state genes that correlated positively (D) and negatively (E) with the model were randomly permuted in these two cases. Up and down regulation are presented by yellow and blue boxes, respectively; grey boxes indicate missing data. The gene expression profiles of the two groups of genes with small perturbation exhibit steady-state characteristics. For single large dose I (233 J/m2 of UVB) or single large dose II (582.5 J/m2 of UVB), the steady-state characteristics of the gene expression disappeared.

