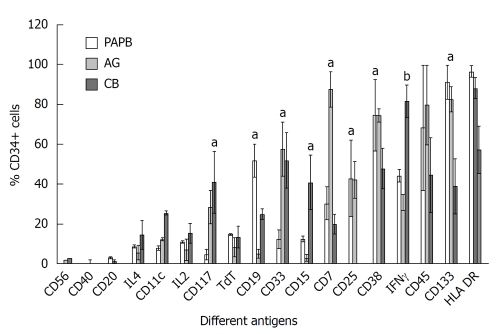
Figure 2.
Comparison of the antigenic profile of CD34+ cells from three different sources: pre-apheresis peripheral blood, apheresis graft and cord blood. Results are expressed as mean percentage ± SE of positive cells. aP < 0.05, bP < 0.0001. PAPB: Pre-apheresis peripheral blood; AG: Apheresis graft; CB: Cord blood; IFN: Interferon.

