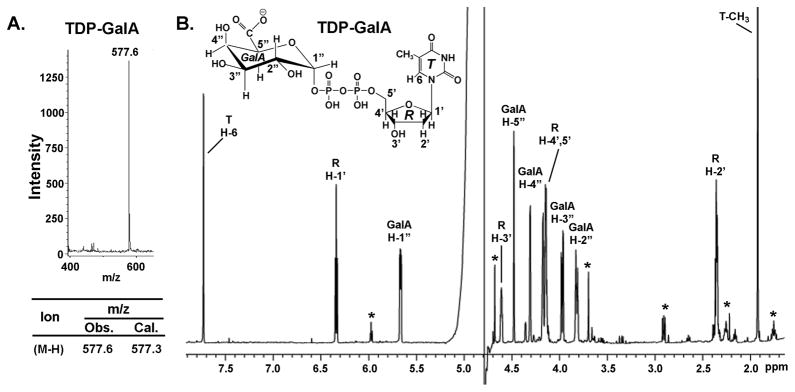
FIGURE 6. 1H-NMR spectroscopic and MALDI-TOF analyses of BcUGlcAE reaction products indicates formation of TDP-α-D-galacturonic acid.
A. The HPLC peaks (Fig. 5C, Panel 2, 3, or 4) corresponding to the product formed by BcUGlcAE was collected and analyzed by MALDI-TOF.
B. 1H-NMR spectroscopy at 600-MHz of HPLC peak from Fig. 5C panel 3. The assignments of each proton are indicated on the spectrum: peaks from proto ns on the thymidine (T) ring are indicated by H, the ribose (R) protons are indicated by H′, and the GalA (G) protons protons are indicated by H″. The peaks marked by * are resonances from impurities.

