
Figure 10.
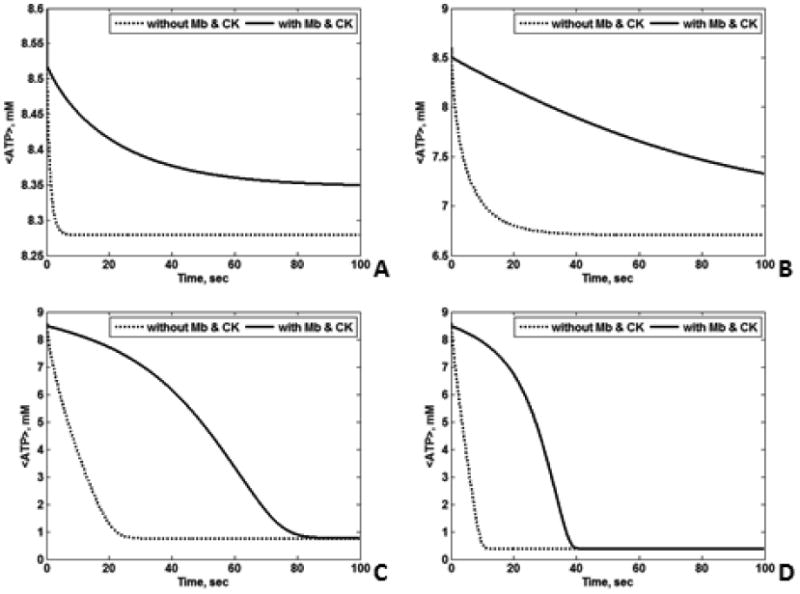
Transient <ATP> with Mb and CK (solid black line) and without Mb and CK (dotted black line) for L = 15 μm, εmito = 0.25, O20 =35.1 μM, and (A) Vmax,ATPase = 60 mM/min, (B) Vmax,ATPase = 90 mM/min, (C) Vmax,ATPase = 120 mM/min, (D) Vmax,ATPase = 150 mM/min. As the Vmax,ATPase increases, the cell starts to be limited by diffusion. When the cell is not limited by diffusion, Mb and CK play the role of temporal buffers. Note the different scaling of the <ATP> axis.