
Figure 6.
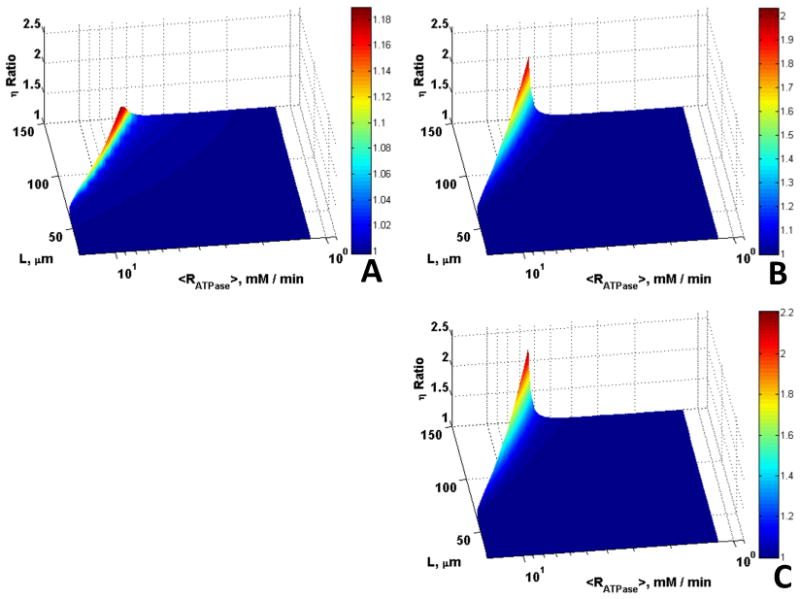
Role of Mb and CK in offsetting diffusion constraints over a broad range of diffusion distances and rates of aerobic ATP demand for O20 = 35.1 μM, εmito = 0.1, L = 25 – 150 μm, and Vmax,ATPase = 1 – 15 mM/min. Surfaces are the ratio of (A) η with Mb vs. without Mb and CK, (B) η with CK vs. without Mb and CK, (C) η with Mb and CK vs. without Mb and CK, vs. L and <Rmax,ATPase>; significantly higher η ratio can be observed in the presence of CK, and the extreme (large L of 150 μm and Vmax,ATPase of 15 mM/min), where the cell operates under diffusion limitation.