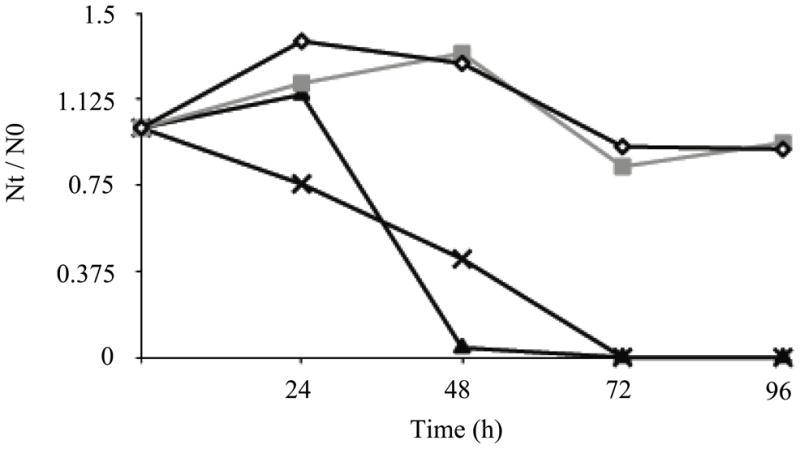
Fig. 2.

Cell growth plot for SCR 4 (open diamonds), SCR 8 (gray squares), AZ 9 (filled triangles) and AZ 11 (crosses) treated with 2.5 μM BENSpm for up to 96 h. Cells were counted with the trypan blue exclusion method to determine Nt/N0 (where Nt is the cell number at the indicated time point, and N0 is the cell number at time of seeding) Data shown are the mean and standard error of three independent experiments with two replicates each.
