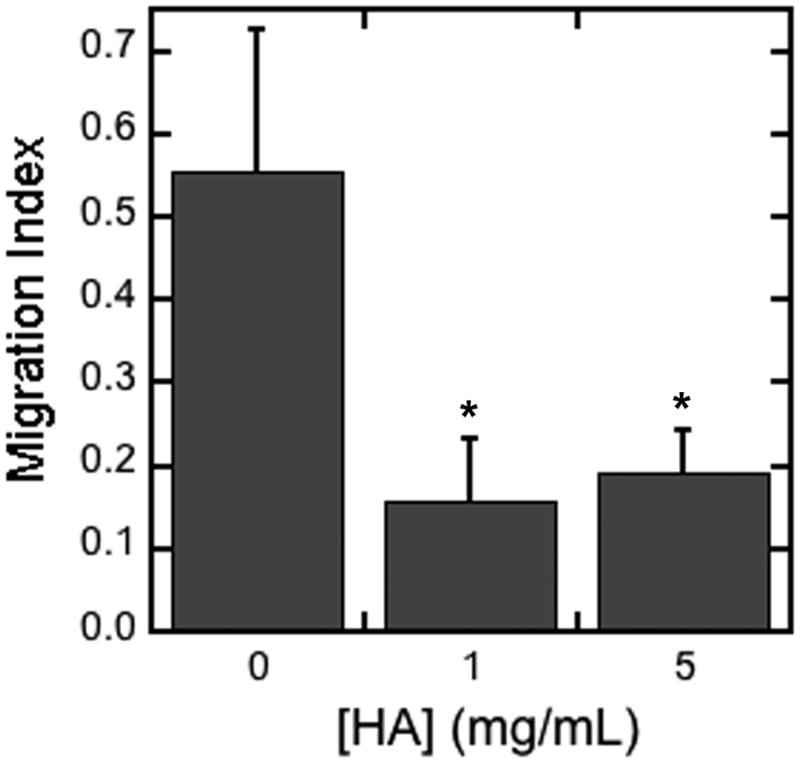
Figure 3. Cell migration through fibrin hydrogels.

Cell migration was determined for hydrogels loaded with multiple dosages of HA (0, 1, 5 mg/mL). The migration index was calculated as number of cells that migrated through the gel and membrane divided by the number of cells that remained on top or in the gel. The symbol * indicates statistical significance relative to control group (without HA) at p < 0.05.
