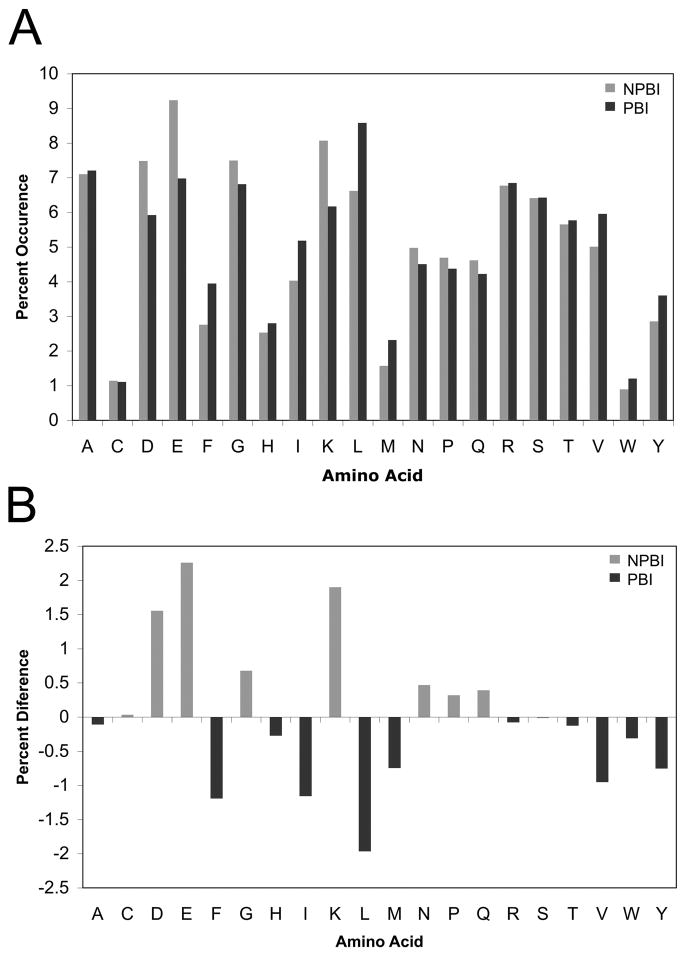
Figure 2.
A, Distribution of the frequencies of the standard amino acids in the dataset used in this study. Black bars correspond to known protein binding interfaces (PBI) and gray bars represent non-protein binding interfaces (NPBI). B, The difference of the amino acid frequency at the NPBI and the PBI. The percentage occurrence of each amino acid at PBI is subtracted from the corresponding value at NPBI.

