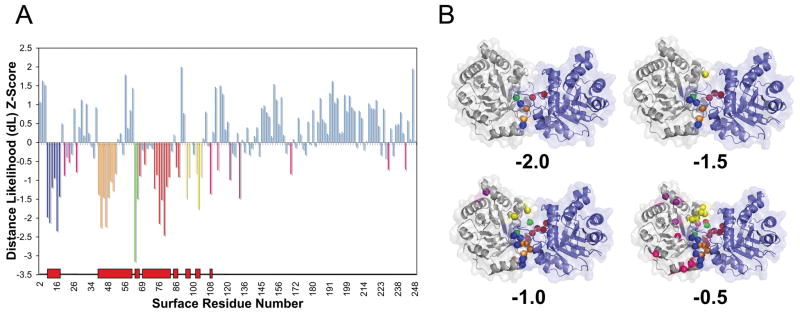
Figure 4.
An example of protein binding interface prediction by BindML (PDB ID: 7TIMA). (A) The colored vertical bars in the graph show residues predicted with a Z-score value at or below threshold values, −2.0, −1.5, −1.0, or −0.5. Each range of sequence signals colored in green, red, blue, orange, and yellow bars corresponds to the first, second, third, forth, and fifth highest scoring regions, respectively. The red blocks along the x-axis indicate the correct interface regions. (B) The predicted residues using the four different threshold values are shown in the same colors on the structure.

