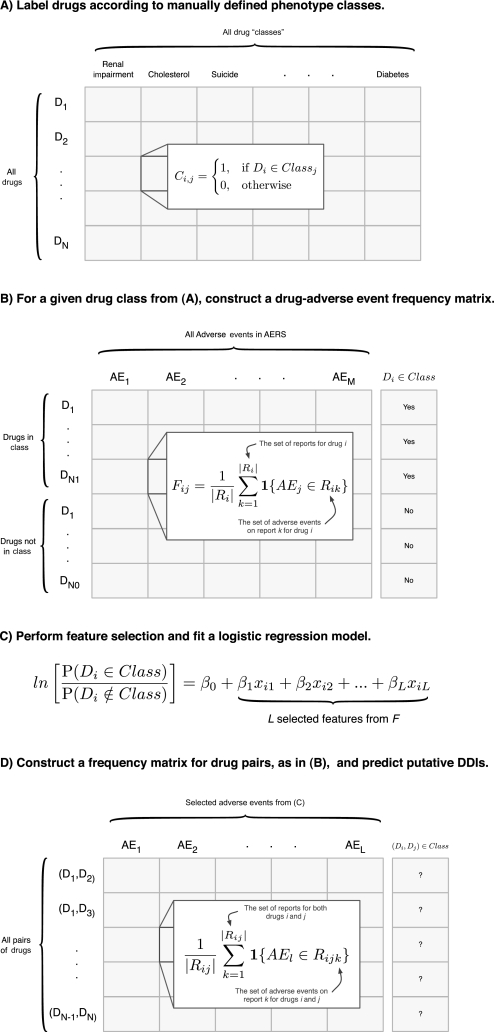
Figure 1.
Methodological overview. (A) Each drug is assigned a label according to their adverse event class, so that each element of the matrix indicates drug i's membership in class j. The fields of this matrix are filled by the user and each column is used as the response variables to train a supervised machine learning algorithm. In this paper we built eight such algorithms for renal impairment, cholesterol, suicide, depression, liver dysfunction, hypertension, hepatotoxicity, and diabetes. (B) Given a particular drug class from (A) (ie, a column), we construct an N by M adverse event frequency matrix, where N is the number of drugs and M is the number of adverse events. Each element of the matrix represents the proportion of reports for drug i which list adverse event j. (C) Since M >> N overfitting the logistic regression model to the training data is a concern. We use feature selection to identify the L most informative adverse events to be used in fitting the logistic regression model. (D) A second adverse event frequency matrix is constructed. The key difference here is that each row represents a drug-pair as opposed to a single drug, as in (B). Note that no data is (continued)shared between these two matrices to ensure they are independent. Therefore each element of this matrix is the proportion of reports for both drugs i and j that list adverse event l. This matrix takes on the same form as the matrix used for fitting the model. This allows us to apply the model and make drug-drug interaction predictions.

