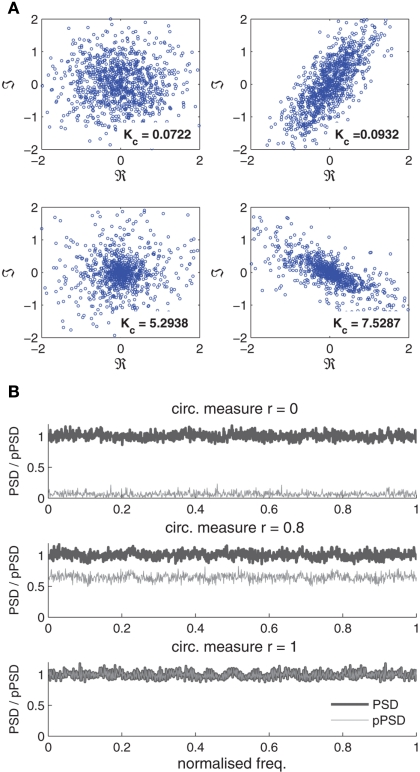
Figure 1.
Illustration of white circular and doubly white complex-valued noises. (A) Scatter plots of complex white noise realisations. Top row: circular Gaussian noise (left) and non-circular Gaussian noise (r=0.81) (right). Bottom row: circular Laplacian noise (left) and non-circular Laplacian noise (r= 0.81) (right). The circularity measure r is defined in (8). The kurtosis values Kc are given for each case. (B) Power spectra (thick gray line) and pseudo-power spectra (thin gray line) of complex Gaussian noises with varying degrees of non-circularity r = {0, 0.8, 1}.

