Figure 10.
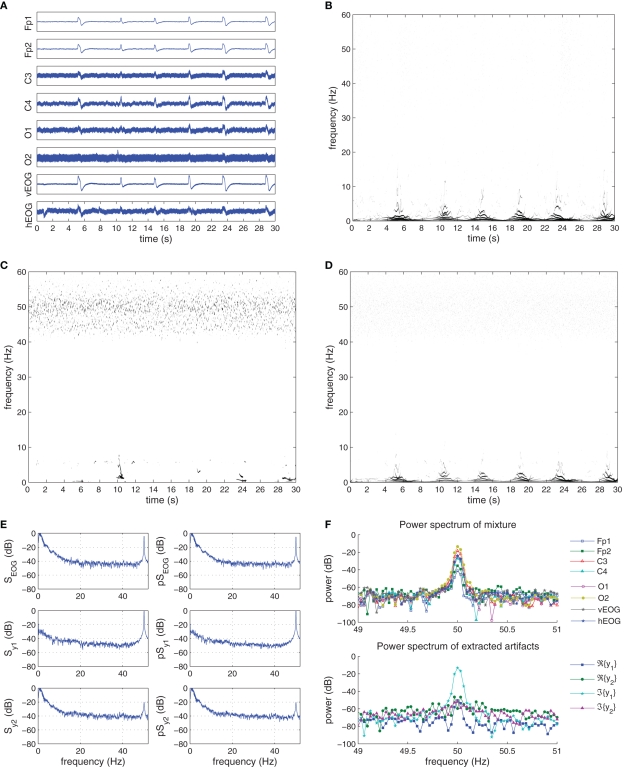
Recorded and extracted artifacts from the “Eyeblink” set. (A) Recorded EEG signals from the “Eyeblink” set. (B) The Hilbert–Huang time–frequency plot of the recorded EEG signals. (C) The Hilbert–Huang time–frequency plot of the extracted line noise 𝕵{y1(k)}. (D) The Hilbert–Huang time–frequency plot of the extracted EOG ℜ{y2(k)}, 𝕵{y2(k)}. (E) The power spectra (S) and pseudo-spectra (pS) of the recorded EOG, and the extracted signals y1(k) and y2(k). (F) The power spectra (S) and pseudo-spectra (pS) of the recorded EOG, and the extracted signals y1(k) and y2(k). (G) Frequency components of the recorded EEG signals and the extracted artifacts at the 50-Hz frequency range. After extraction, the power line noise is contained in 𝕵{y1}.

