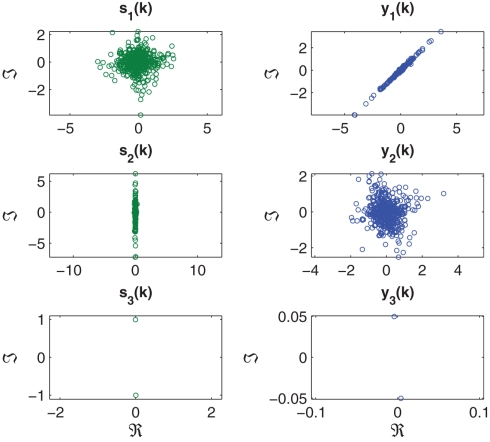
Figure 3.
Scatter plot of the complex-valued sources s1(k), s2(k), and s3(k), with the signal properties described in Table 1 (left hand column). Scatter plot of estimated sources y1(k), y2(k), and y3(k), extracted according to a decreasing order of kurtosis (β = 1) (right hand column).

