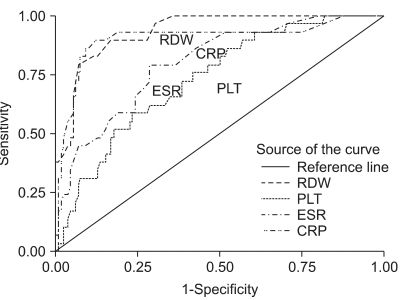
Fig. 2.
ROC curves for PLT, CRP, ESR, and RDW compared with the activity level of CD (CDAI below or above 150; area under the curve for RDW is 0.935; p<0.001).
ROC, receiver operating characteristic; PLT, platelet counts; CRP, C-reactive protein; ESR, erythrocyte sedimentation rate; RDW, red cell distribution width; CD, Crohn's disease; CDAI, CD activity index.

