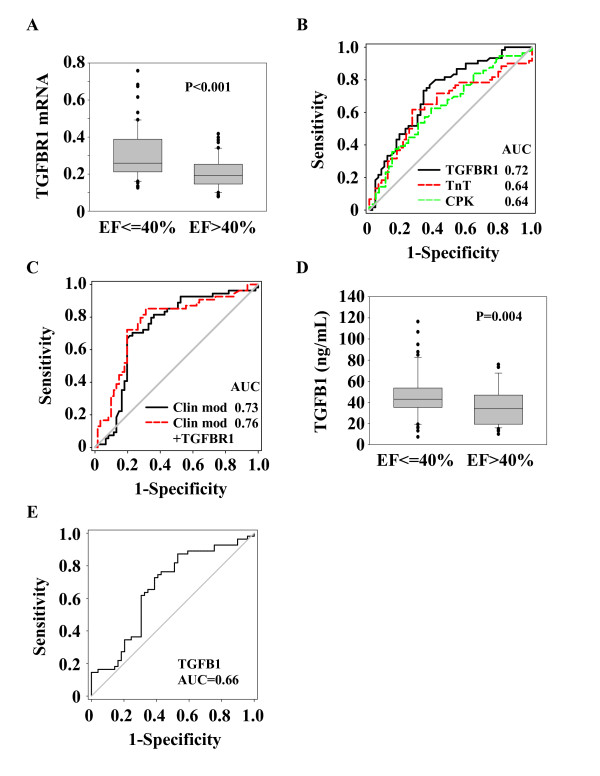
Figure 3.
Expression levels and prognostic values of TGFBR1 and TGFB1. Blood samples from 115 MI patients obtained upon admission were used to measure TGFR1 mRNA expression in blood cells by quantitative PCR and TGFB1 plasma level by ELISA. TGFBR1 mRNA expression was normalized to SF3A1. (A and D) Box-plots showing that TGFBR1 and TGFB1 are over-expressed in patients with LV dysfunction (EF ≤ 40%) compared to patients with preserved LV function (EF > 40%) assessed at 4-months follow-up. The lower boundary of the box indicates the 25th percentile, the line within the box marks the median, and the upper boundary of the box indicates the 75th percentile. Whiskers (error bars) above and below the box indicate the 90th and 10th percentiles. (B-C-E) ROC curve analysis showing the performance of TGFBR1 and TGFB1 measured at presentation, peak levels of TnT and CPK, and a mixed clinical model (Clin mod; including age, gender and time to reperfusion) to predict LV dysfunction. AUCs are indicated.

