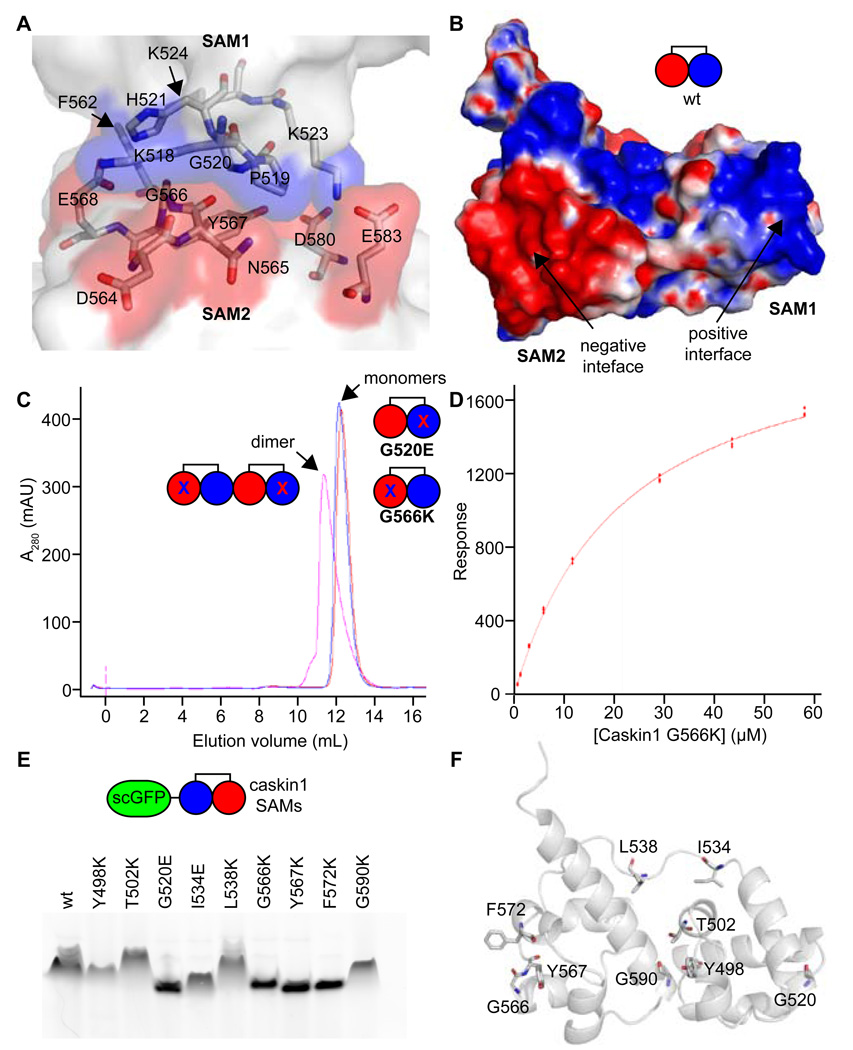
Figure 3. Biochemical Analysis of the Polymer.
(A) A close-up view of the polymer interface is shown. Positively and negatively charged interfaces are colored in transparent blue and red surfaces, respectively, while the rest of the molecules are white. Select residues are shown in stick representation and colored according to atom type (C = white, N = blue, and O = red). (B) The electrostatic surface potential is shown for a Caskin1 tandem SAM molecule from the P41 crystal structure with the His-tag removed (positive = blue and negative = red). A simple cartoon model is also shown. (C) Gel filtration of interface mutants G520E and G566K reveal that they are monomeric (measured 23.6 kDa and 22.5 kDa using globular protein standards; calculated 16.5 kDa) but form a dimer when mixed since they both still have one functional interface (measured 32.3 kDa; calculated 34.0 kDa). (D) The binding affinity of the Caskin1 SAM polymer interface was determined using surface plasmon resonance (Kd = 22 ± 1 µM). The G520E mutant was coupled to the SPR chip and the G566K mutant was in the mobile phase. (E) Fusion proteins were made to a negative super-charged variant of GFP (scGFP) and several Caskin1 mutants. Fusion proteins migrate towards the cathode on a native PAGE gel due to the charge on the GFP, but proteins which maintain the ability to polymerize migrate more slowly. Mutations to the polymer interface (G520E, G566K, Y567K, and F572K) run the fastest. (F) The Caskin1 SAM domains are shown as cartoon a model with selected amino acids shown in stick representation to indicate the location of each mutation investigated.

