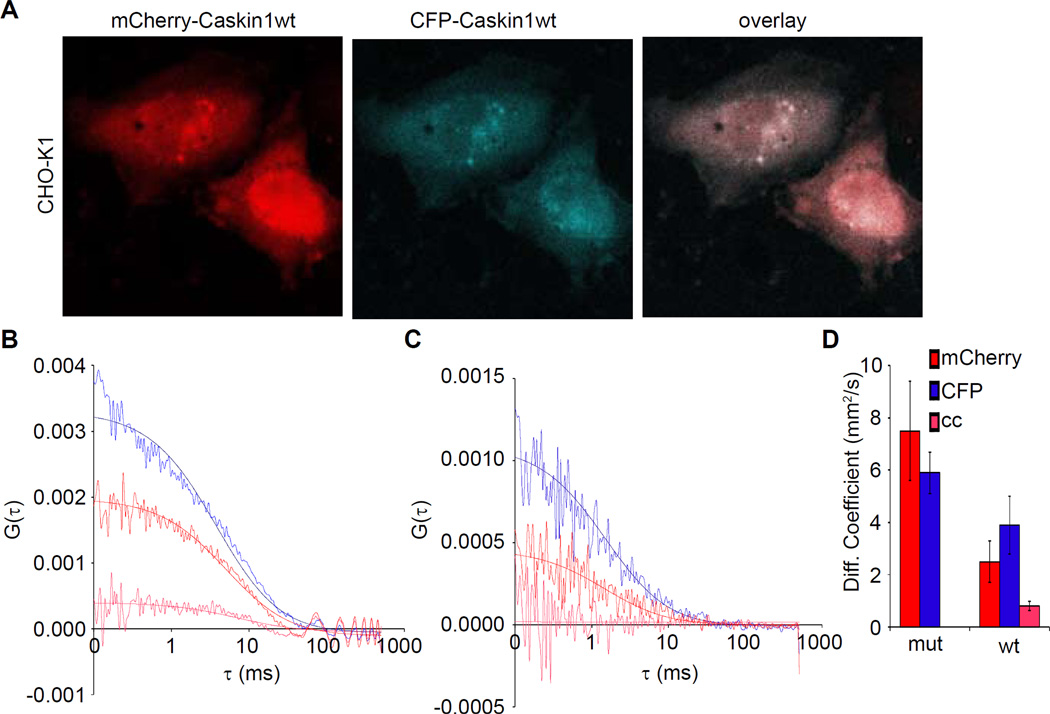
Figure 4. Caskin1 Self-Association in Living Cells.
(A) CHO-K1 cells co-transfected with mCherry-Caskin1wt and CFP-Caskin1wt fusion proteins both express to the cytoplasm. (B) The cross-correlation profile derived from the auto-correlation function (ACF) profiles of mCherry-Caskin1wt and CFP-Caskin1wt fusion proteins, indicate these species self-associate (blue = ACF of CFP, red = ACF of mCherry, and pink = cross-correlation). (C) The cross-correlation profile derived from the ACF profiles of mCherry-Caskin1mut and CFP-Caskin1mut indicate that these species do not self-associate (colored as in panel B). (D) A bar graph of the diffusion coefficients of the individual and associated species (mean ± std. dev.).

