
Figure 3.
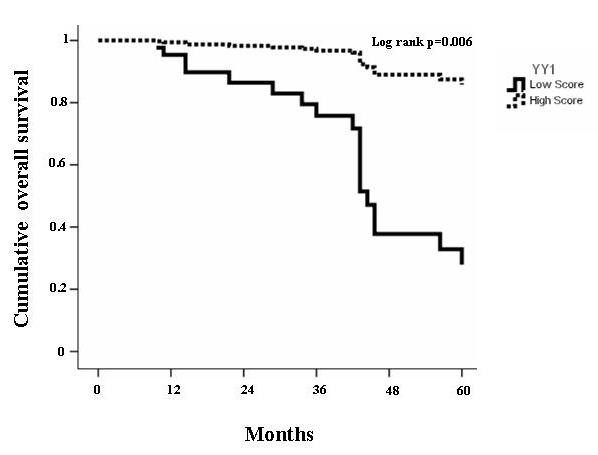
Cox regression of cumulative survival rate of all patients. The graph shows the cumulative overall survival rate of high grade osteosarcoma patients (n = 41) using Cox multivariate analysis. The data indicates that higher score of YY1 (3-4) predicts mortality during the follow up. (HR = 8.353, 95%CI = 1.863-37.451, p = 0.006) HR= hazard ratio; CI=confidence interval.