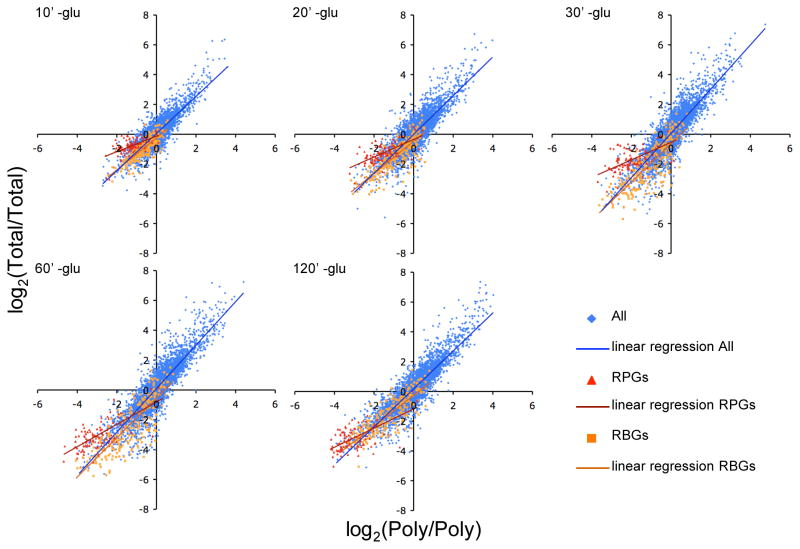
Figure 3. RPGs and RBGs differ in their post-transcriptional responses to glucose withdrawal.
Kinetics of total mRNA abundance changes compared to polysomal mRNA abundance changes following glucose withdrawal. RPG mRNAs (red triangles) were preferentially depleted from the polysomal RNA pool compared to the total mRNA pool at early times. RBGs (gold squares), like most genes (blue diamonds), disappeared from the totals in concert with their loss from polysomes. After 120 minutes –glucose, the RPGs T/T versus P/P ratios more closely resembled the population as a whole, indicating a loss of a non-polysomal pool of mRNA. The results of linear regression analysis for each group of genes are shown by color-coded lines. See also Figure S4.

