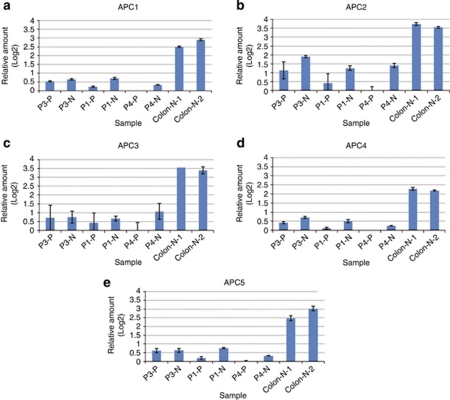
Figure 6.
Expression from the two promoters measured in normal colon mucosa (P1-N, P3-N and P4-N) and adenoma (polyps, P1-P, P3-P and P4-P) from mutation carriers and normal colon mucosa from healthy controls (colon-N-1 and colon-N-2) as measured by Q–PCR by the five assays, APC1–APC5. The data is normalized to zero for the sample with the lowest expression for each assay. The error bars indicate the standard deviation for the RT replicates. (a) APC1 corresponds to transcript NM_001127511.1 from promoter 1B. (b) APC2 corresponds to transcript NM_000038.4 from promoter 1A. (c) APC3 corresponds to transcript NM_001127510.1 from promoter 1A. (d) APC4 corresponds to all transcripts generated from both of the promoters, 1A and 1B. (e) APC5 corresponds to all transcripts generated from both of the promoters, 1A and 1B.

