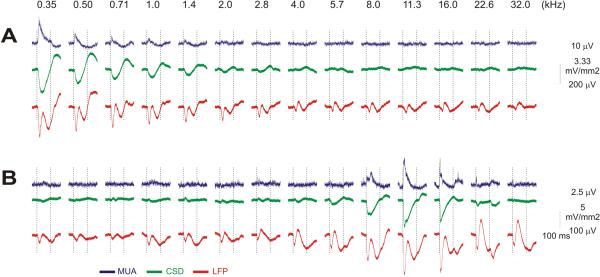
Figure 2. Time courses of responses to tones.
Tone-evoked MUA, CSD and LFP responses at two example sites (A and B). MUA, CSD and LFP responses are colored blue, green and red, respectively. All time-bases extend from −30 to 170 ms relative to the onset of 100 ms duration tones, whose onsets and offsets are indicated by vertical dotted lines. Tone frequencies are indicated on the top row (kHz).

