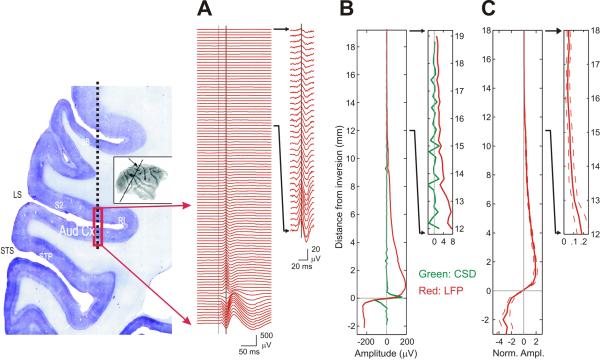
Figure 5. Spread of auditory LFP responses perpendicular to the auditory cortex.
(A) Profile of auditory LFP responses to 100 ms BBN stimulus measured during an electrode penetration from the dura down through the depth of auditory cortex (schematic of the penetration depicted on a brain coronal section at the left; inset shows that approximate position and angle of the section). Gray vertical line indicates stimulus onset. Black vertical line indicates the timing 24 ms post onset of stimuli, used to derive the amplitude profiles. Inset shows expanded view of top one third depths, and same applies to two other columns (B and C). (B) The distribution of the amplitude of LFP (red) and CSD (blue) signals at 24 ms for the example shown in A. The origin of the vertical axis is set to the depth of inversion of polarity within the auditory cortex. (C) Distribution of median of normalized amplitudes at 24 ms (n=105). Normalization was done with respect to the mean absolute amplitudes of all depths for each penetration site. For each track, recording depths were rounded to depths with intervals of 0.5 mm and mean amplitudes of multiple depths rounded to each step were used. Split lines show 95 % confidence intervals of median. On the left, a coronal section of Nissl stained brain is shown to illustrate the electrode track. (LS, lateral sulcus; STS, superior temporal sulcus; 3B; somatosensory area 3B; S2, secondary somatosensory cortex; RI, retroinsular cortex; STP, superior temporal polysensory area)

