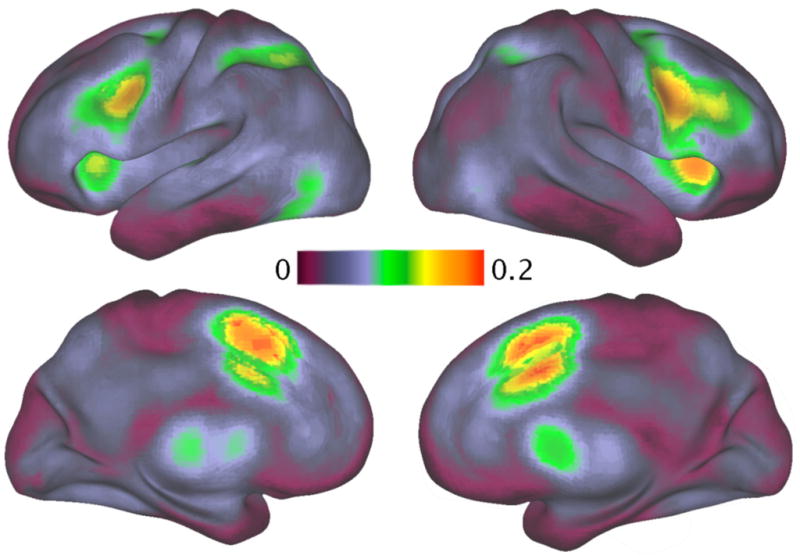
Figure 1.

A rendering of base rates of activation across 3,489 studies in the literature; increasingly bright yellow/red colors reflect more frequent activation across all studies, with the reddest regions active in more than 20% of all studies. Regions of most frequent activation included the anterior cingulate cortex, anterior insula, and dorsolateral prefrontal cortex. Reprinted with permission from Yarkoni et al., 2011.
