
Figure 3. ΔO2 for 80 stimuli as a function of time between stimuli (interpulse interval).
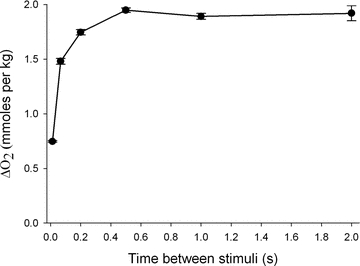
Eighty stimuli given within 1 s (80 Hz or interpulse interval of 0.0125 s) consumed an average of 0.747 μmol g−1 O2 but as the interpulse interval increases, the ΔO2 increased about 2.6-fold until a maximum was reached at the interpulse interval of 0.5 s (2 Hz). The ΔO2 remained constant thereafter as the interpulse interval increased. Hence, for these experiments we used an interpulse interval of 0.5 s to determine the ΔO2 (and ATP utilization) for the first twitch. Error bars shown are ±SEM. n = 6–11 for all points except for 0.5 Hz where n = 4. These measurements were performed in the absence of BTS, and hence include the crossbridge ATP utilization. In another set of experiments where ΔO2 was measured in the presence of BTS, ΔO2 rose 4.13-fold from 0.378 ± 0.026 μmol g−1 (n = 4) at 80 Hz to 1.56 ± 0.021 μmol g−1 (n = 4) at 2 Hz.