
Figure 4. Furaptra fluorescence responses in a swimbladder fibre stimulated by either a single stimulus or a 10-stimulus, 83.3 Hz train.
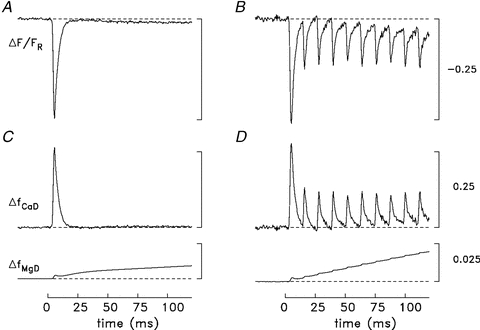
A and B, original records of ΔF/FR after scaling by the factor 1.46 as described in Methods; the records in A and B are an average of 3 and 2 sweeps, respectively. Fibre diameter, 35 μm; sarcomere spacing, 2.7 μm; [DT], 0.2 mm in A and 0.1 mm in B. C and D, the ΔF/FR records were separated into their putative contributions from Δ[Ca2+] and Δ[Mg2+] as described in Methods; these components were then converted to ΔfCaD and ΔfMgD with eqns (1) and (3), respectively. In both C and D, ΔfCaD goes slightly below baseline at t≈ 25 to 30 ms. This is likely to indicate a slight contamination of the ΔF/FR records with a small movement artifact. The calibration bars in B and D also apply in A and C.