
Figure 7. Responses like those in Fig. 6 for two other versions of the swimbladder model.
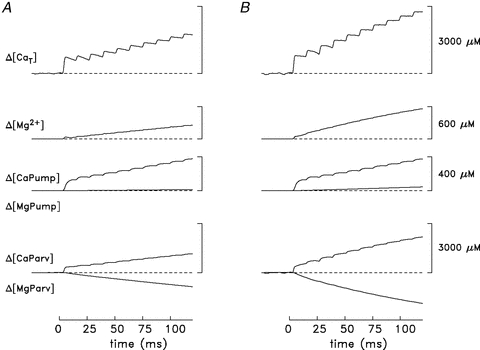
In both A and B, the model was also driven by the Δ[Ca2+] trace shown in Fig. 6 but the pump concentration was 980 rather than 190 μm (Model 2; see text). In B, the rate constants for the reactions of Ca2+ and Mg2+ with parvalbumin were 3-fold larger than the standard values (Model 3; see text). For both models, the FDHM of each release flux was ∼1 ms. The calibration values in B also apply in A.