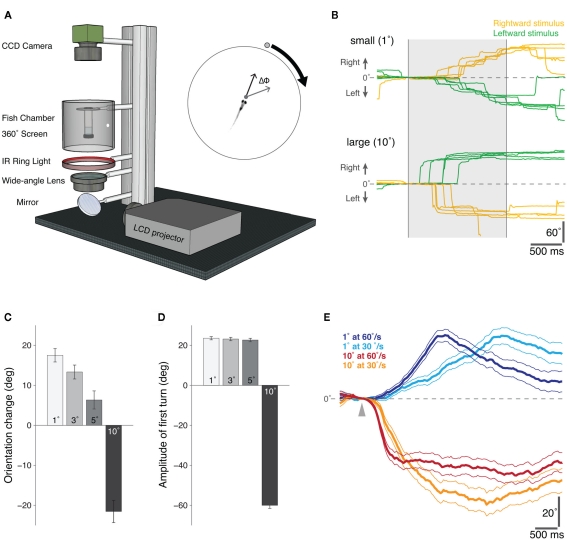
Figure 1.
Behavioral responses of freely swimming zebrafish to moving visual stimuli presented in a “Virtual World.” (A) Schematic diagram of the “virtual visual world” assay for freely swimming larval zebrafish. An LCD projector presents the computer-generated stimulus, via a wide-angle lens, onto a 360° screen. The fish is suspended within a transparent chamber held at the center of the screen and illuminated with an infrared ring-light from below. An infrared-sensitive CCD camera continuously tracks the position and orientation of the swimming zebrafish in real-time (40 Hz). At the start of each trial, the visual stimulus – a moving circular spot of varying size and speed – was positioned directly in front of the fish and then moved 90° to either the left or right, whilst the change in orientation of the fish (ΔΦ) was recorded in real-time (inset). (B) Example orientation trajectories for fish presented with rightward (yellow) and leftward (green) moving small (top: 1° diameter, 60°/s) and large (bottom: 10° diameter, 60°/s) visual stimuli. The shaded region indicates the period of stimulus presentation. Positive angles indicate a rightward change in the orientation of the larva, and negative angles a leftward change. (C) The mean change in orientation during the presentation of moving spots of different sizes, error bars report s.e.m. (1°, n = 705; 3°, n = 690; 5°, n = 646; 10°, n = 615). Positive orientation changes are in the direction of stimulus motion. (D) The mean amplitude of the first directed turn, i.e., directed toward the attractive stimuli (1°, 3°, and 5° diameter spots) and directed away from the repulsive stimulus (10° diameter spot), error bars report s.e.m. (1°, n = 366; 3°, n = 343; 5°, n = 327; 10°, n = 330). (E) The difference between the average orientation trajectories for stimuli moving leftward versus rightward are shown for an attractive (1°) and repulsive (10°) spot moving at two different speeds (fast, 60°/s and slow, 30°/s). The arrowhead marks the time at which the stimulus appears. The different time-courses of the response trajectories for the small (attractive) stimuli of different speeds suggests a visual tracking behavior, possibly related to the tracking phase of natural prey capture; error lines report s.e.m. (1° at 60°/s, n = 705; 1° at 30°/s, n = 561; 10° at 60°/s, n = 615; 10° at 30°/s, n = 479).

