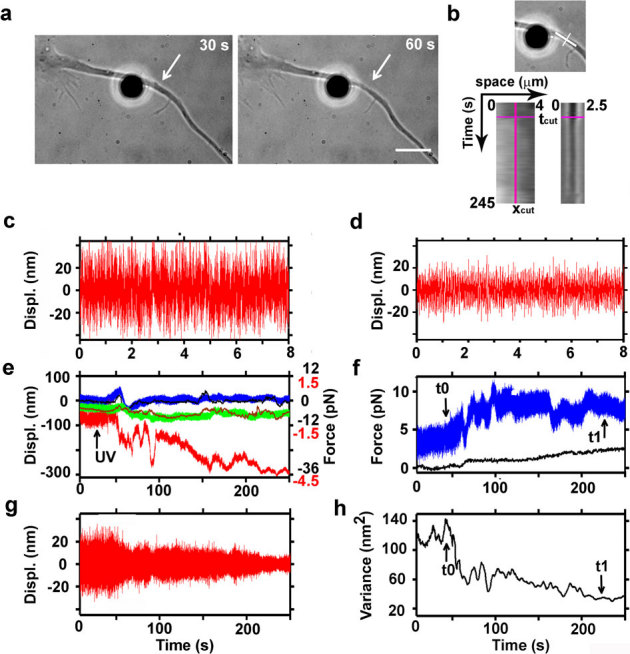
Figure 5. Measurements of the release of tension during laser ablation of hippocampal axons.

(a) Bright field images acquired during ablation of an axon. A fibronectin-coated bead is attached to the membrane (silica bead, Ø 4 μm) and held in an optical trap. Average power of the IR laser at the sample is 35 mW. White arrows indicate the lesion site. Bar is 5 μm. (b) Kymograph analysis along lines parallel and perpendicular to the axon (white lines, upper panel), upstream and downstream of the lesion site (bottom left panel), and on the lesion site (bottom right panel), before and after the cut (pink lines on kymograph: xcut, position of the lesion; tcut, time of the cut). (c) Filtered z trace of the bead held away from the axon. (d) Filtered z trace of the bead attached to the axon. The high pass filter with cutoff at 10 Hz was previously described37. (e) Recorded traces by back focal plane interferometry of the bead position in the optical trap (upper panel). Blue, green and red traces represent the bead position along x, y, and z axis, respectively (Black numbers on the right vertical graph axis indicate the force traces in the x, y directions; red numbers the force along the z direction). Sampling rate is 4 kHz. Black and brown traces are the x and y positions obtained by video tracking. (f) Total amplitude of the force measured in in the x, y, and z axis shown in panel e (blue trace: Ftot = √(Fx2 + Fy2 + Fz2)). Total amplitude of the displacement of a scratch performed on the culture support measured by video tracking (in pN), to monitor the stage drift (black trace). (g) Z trace (shown in panel e) filtered with a high pass Butterworth filter with cutoff at 10 Hz. (h) Total variance of the Brownian motion of the bead attached to the axon (t0 and t1 indicate respectively the beginning and the end of tension release in the axon after dissection).
