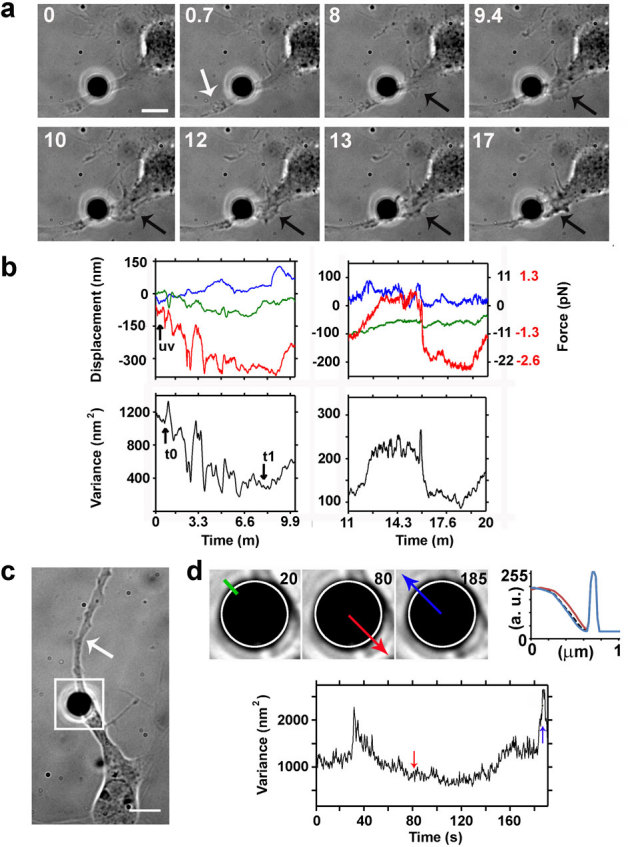
Figure 7. Force spectroscopy measurements during axonal regeneration.

(a) Bright field images acquired during ablation and regeneration of the injured axon. A fibronectin coated bead (silica bead, Ø 4 μm) attached to an axon of a hippocampal neuron (2 DIV) and held in an optical trap. The average power of the IR laser at the sample is 35 mW. The white arrow indicates the site of damage and black arrows indicate the formation of a lamellipodium. Bar is 5 μm. (b) Traces obtained by back focal plane interferometry of the bead position in the optical trap (upper panels). Blue, green and red traces are from the x, y, and z position of the bead, respectively. Right panel only: black numbers on right vertical graph axis indicate the force traces in the x and y direction; red numbers the force in the z axis). Total variance of the Brownian motion of the bead attached to the axon during and after UVA laser dissection. t0 and t1 indicate the beginning and the end of tension release, respectively (lower panels). Sampling rate is 4 kHz. (c) Bright field image of a hippocampal neuron with a fibronectin coated bead (silica bead, Ø 4 μm) attached to the axon. The time-lapse imaging started 5 minutes after the axon lesion (white arrow). Bar is 5 μm. (d) Magnification of the bead position (square box in panel c) taken at 20, 80 and 185 seconds. The upper right panel shows the intensity profile along the green line (top left to bottom right, 1 μm) in the first frame to detect the bead displacement. The dashed black, red and blue lines correspond to intensity profile calculated on the three frames (from left to right, respectively). The lower panel shows the total variance of the bead Brownian motion recorded between 0 and 200 seconds, 5 minutes after axon lesion. The red and blue arrows indicate the level of the variance corresponding to the events shown in the upper panel.
