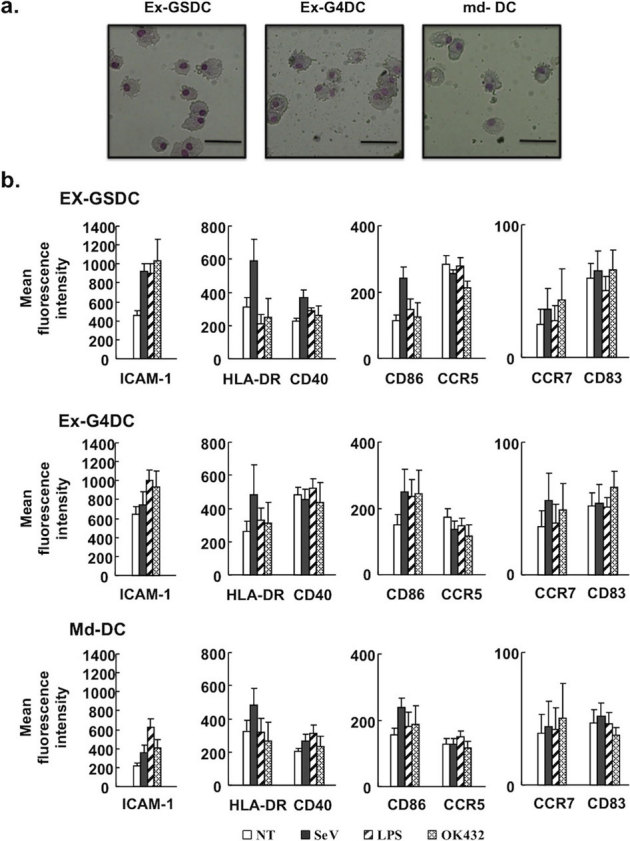
Figure 2. In vitro characterization of expanded human DCs.

(a) Morphology of rSeV-activated DCs. Wright-Giemsa–stained cytocentrifuge preparations are shown. Bars in panels = 30 um. (b) FACS analyses assessing the expression of typical surface markers. DCs with or without further stimulus were subjected to FACS analyses. A bar graph indicating the corresponding mean fluorescent intensity (MFI) containing data from four independent experiments is shown.
