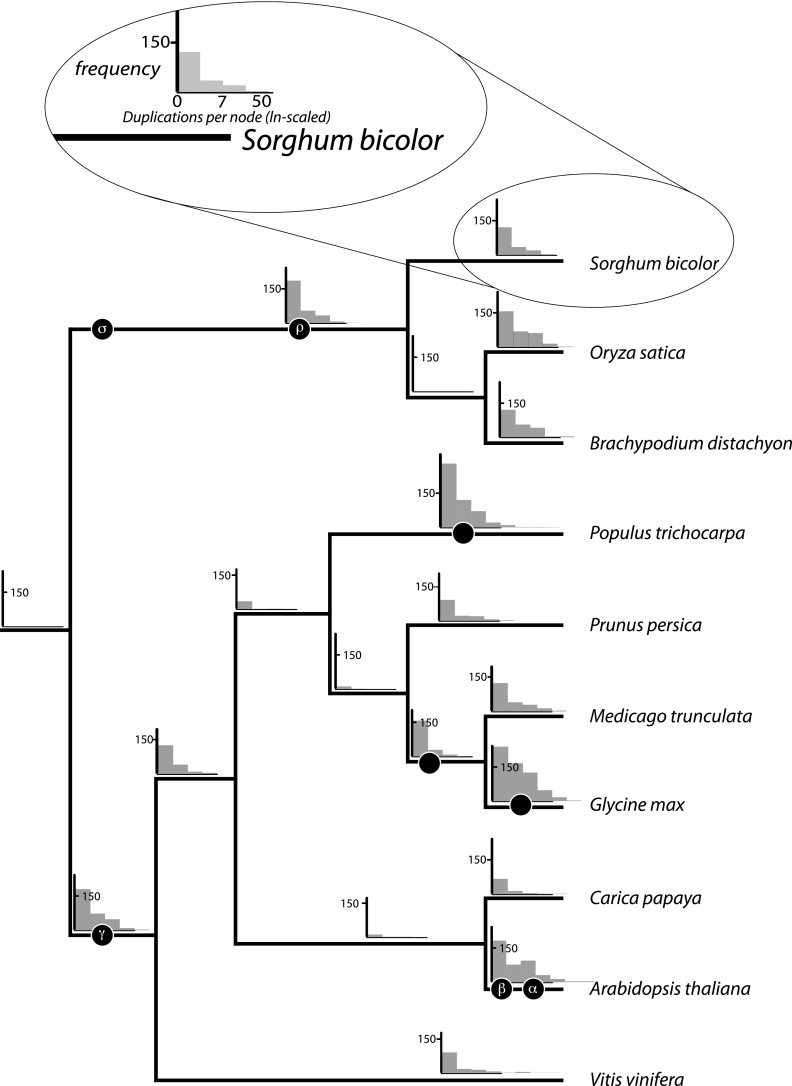
FIG. 1.—
Plant species used in reconciling gene trees. The phylogenetic relationships (branch lengths are arbitrary) among these species have been described previously (Moore et al. 2007; Paterson et al. 2009). The histograms depict the number of duplications per gene family. Thus, on the x-axes is the number of duplicates observed in a family at that node in the tree (on a natural log scale). The y-axes are then the frequency of families with that number of duplications. The scale is consistent across histograms. Black circles indicate whole-genome duplication events.

