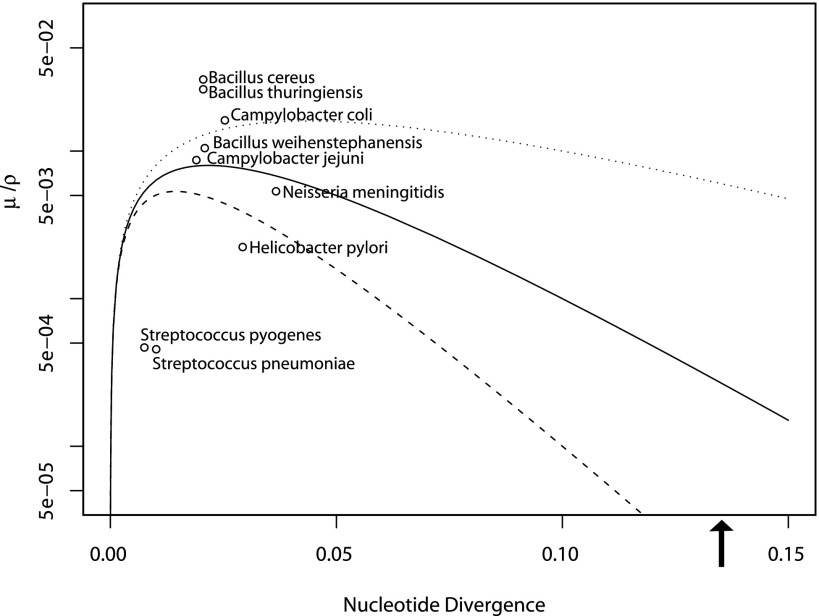
Fig. 4.—
Values of nucleotide diversity, HR rate, and mutation rate estimated from strains that belong to a range of microbial species plotted in relation to the equilibrium threshold for cohesive recombination (values plotted on a log scale to allow all points to be visualized). These values are intended as estimates of values that may occur between different populations within the named species. The recombination distance factor was varied to demonstrate the impact of this value on the threshold of cohesive recombination. The distance factors that were used are −20 for the solid line (as presented in fig. 1), −10 for the dotted line, and −30 for the dashed line. Values for μ/ρ are calculated as π (r/m)−1 from the values of r/m in Vos and Didelot (2009) and π is calculated from the same data sets provided by Dr Michiel Vos. A larger set of values and species names are given in supplementary table S1 (Supplementary Material online). The arrow shows the average nucleotide divergence between Campylobacter coli and Campylobacter jejuni based on MLST loci (Dingle et al. 2005) values for C. coli were calculated from Lang et al. (2009) as described in supplementary table S1 (Supplementary Material online).

