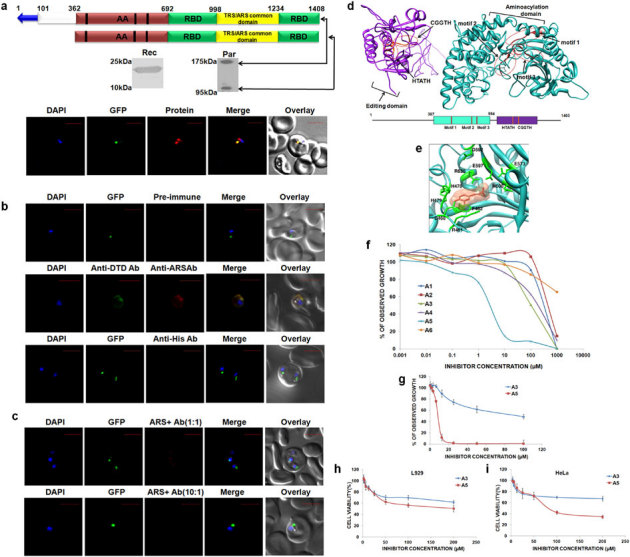
Figure 4. Expression, localization, modeling and inhibitor screening for Pf-Ed-ARS.

(a) Upper panels show P. falciparum aminoacyl-tRNA synthetase name, domain/ subdomain features. Middle panels show P. falciparum aminoacyl-tRNA synthetase expression in parasites (Par) and detection of recombinant P. falciparum aminoacyl- tRNA synthetase domains (Rec) by western blot analysis. Lower panels display their cellular localizations. The parasite line used was GFP-tagged (strain D10 ACPleader-GFP) where apicoplast fluoresces green. DAPI staining is in blue while aminoacyl-tRNA synthetases are stained with Alexa594 (red). Editing domains are colored yellow, aminoacylation domain (AA) in red; RNA binding domain (RBD) is in green and the unidentified domain is colored in white. Blue arrow represents apicoplast targeting sequences predicted by PATS. Conserved motifs are highlighted in black strips. (b) Upper and lower panels show confocal IFA with pre-immune sera and with anti-histidine antibodies, whereas the middle panel depicts cytoplasmic staining of Pf-DTD. (c) Upper and lower panel show results of competitive IFAs with rabbit anti-Ed-ARS antibodies which were pre-incubated with Ed-ARS in molar ratios of 1∶1 and 10∶1 respectively. (d) Pf-Ed-ARS model with aminoacylation (AA) and editing domains (ED). The corresponding primary sequence domain structure is shown at bottom. AA motifs 1, 2 and 3 and ED motifs HXXXH and CXXXH are noted with red circles. (e) Pf-Ed-ARS-A5 inhibitor complex showing the docking of A5 within the aminoacylation domain of alanyl-tRNA synthetase. (f) Parasite growth inhibition assays using inhibitors (A1–A6, concentration range 1 nM to 1 mM) identified based on modeling of 3D structure. (g) IC50 value calculation of A3 and A5 compounds by using two fold dilutions of the same compounds. (h–i) Cytotoxicity activity measurements using MTT assay in concentration range of 1 µM–200 µM.
