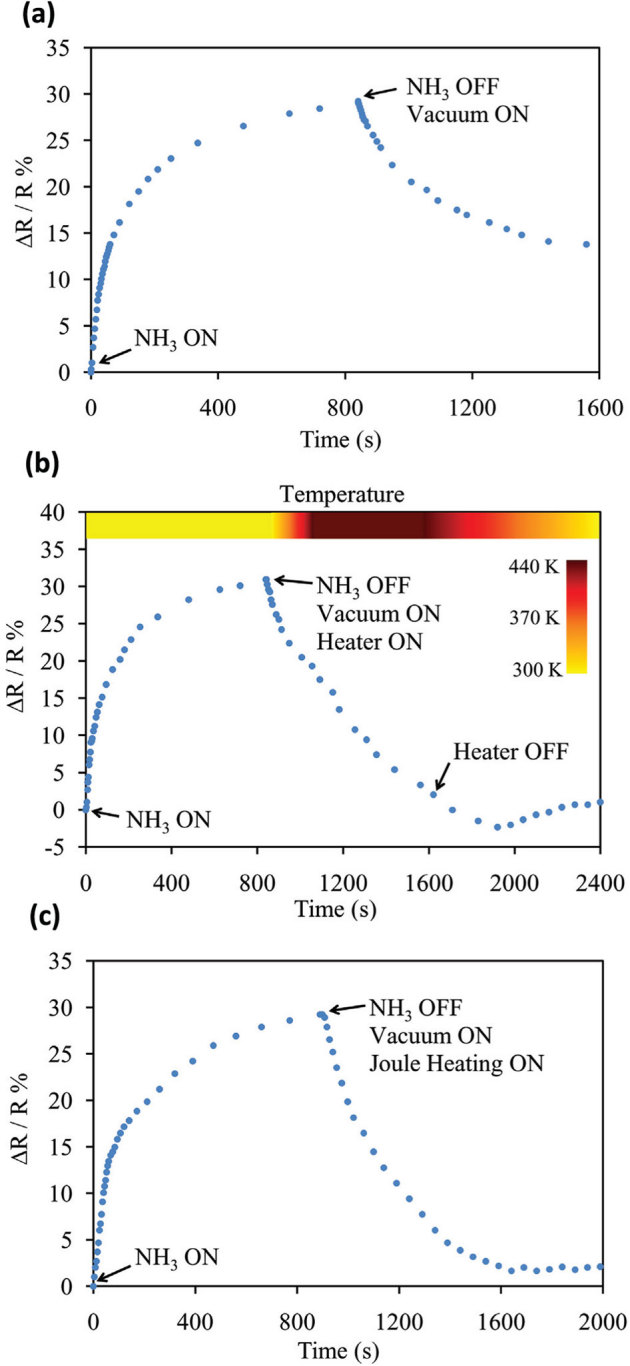
Figure 2. GF sensor response.

Change in the normalized resistance of the GF as a function of time during adsorption of ∼1000 ppm of NH3 and desorption using (a) room temperature degassing and (b) high temperature degassing. The color bar at the top of the graph in (b) shows the change in temperature as a function of time. (c) Corresponding adsorption and desorption response obtained by using Joule heating of the sample during the desorption step. The control current supplied to the GF to heat it to ∼400 K is ∼125 mA.
