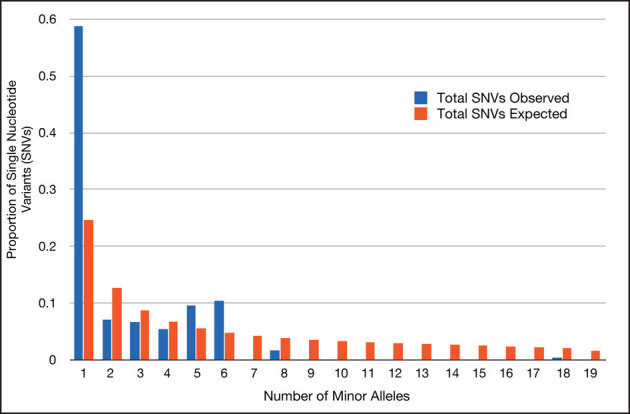
Figure 2. Histogram reporting the proportion of single nucleotide variants with minor alleles seen one or more times in the 39 worldwide B. anthracis strains sequenced.

This site frequency spectrum shows an excess of rare single nucleotide variants (blue) relative to the neutral equilibrium expectation (red).
