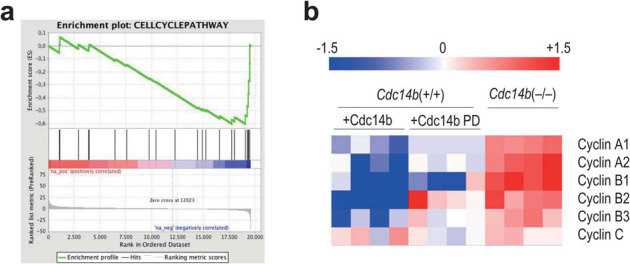
Figure 5. Altered transcriptional profiles in Cdc14b-deficient cells.

(a) Transcriptional alteration of cell cycle regulators in Cdc14b-null cells (blue side in the red-blue bar; FDR = 0.013). Gene annotations were retrieved from Biocarta. (b) Relative levels of the indicated transcripts in Cdc14b-null cells or in wild-type cells overexpressing Cdc14b or the phosphatase-dead (PD) form of Cdc14b. Fold induction is in red whereas fold repression is in blue. Cdc14b-null cells were normalized versus the levels in wild-type cells whereas overexpression of Cdc14b or Cdc14b PD was normalized versus cells transfected with the empty vector.
