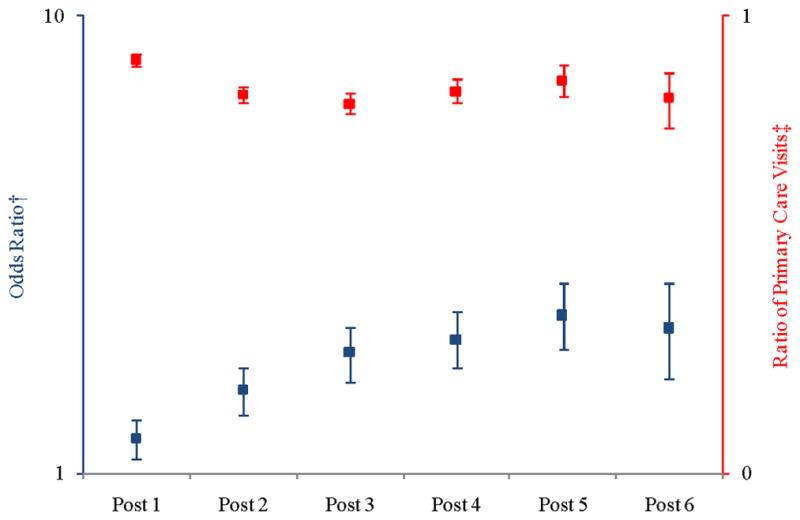
Figure 4.

Adjusted Ratio of Counts of Primary Care Visits in Post-surgical Periods compared to Pre-surgical Period
† Probability of having no primary care visits (
 )
)
‡ Count ratio conditional on having any primary care visits (
 )
)
Notes: Each post year refers to time after surgery. For example, “Post 1” is equivalent to the first year after surgery. The squares represent the point estimate for each year along with the corresponding confidence interval. The model controlled for morbidity level, diabetes severity index, sex, health plan site, linear age, and obesity propensity. We used the biased corrected percentile confidence intervals (rather than the normal theory confidence intervals) to account for the skewed nature of the data. Y-axes are presented on logarithmic scales.
