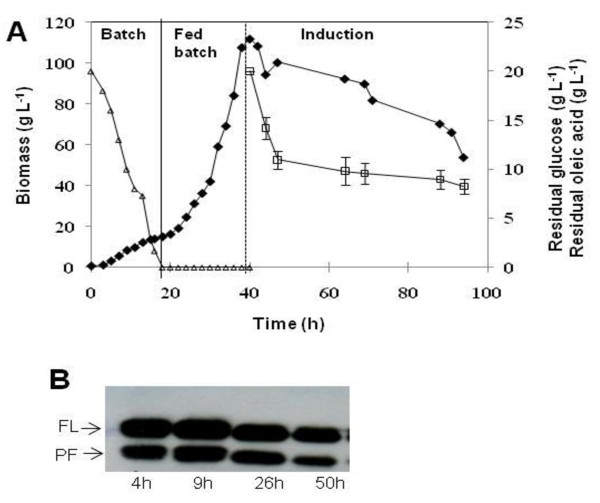
Figure 1.
Time course of biomass (closed diamond), glucose concentration (open triangle), and residual oleic acid concentration (open square) in a glucose exponential fed-batch culture. The solid vertical line indicates the start of feeding, and the dotted vertical line indicates the addition of 20 g L-1 oleic acid (A). Western blot analysis under reducing conditions with a polyclonal antibody against huIFN α2b (B). FL and PF correspond to the full-length and proteolytically degraded forms of huIFN α2b, respectively. Time (h) is the number of hours after induction with oleic acid. Bars indicate the mean values of two independent measurements.

