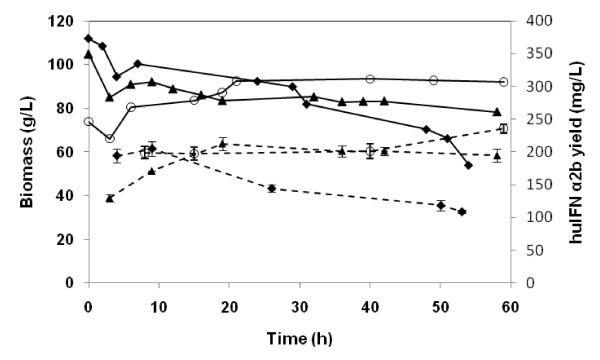
Figure 2.
Time course of biomass accumulation and huIFN α2b production during the induction phase. Induction with oleic acid as the sole carbon source, and at an initial biomass level of 110 g L-1 (closed diamond), induction using glucose as a cosubstrate with oleic acid and at a biomass level of 105 g L-1(closed triangle) and induction with glucose and oleic acid at an initial biomass level of 73 g L-1 (open circle). Dotted lines indicate huIFN α2b production. Bars are the mean values of three different measurements.

