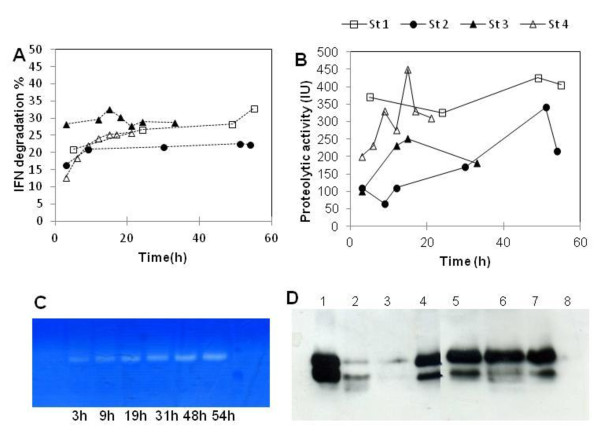
Figure 4.
Percentage huIFN α2b degradation (A) and protease activity (B) during the various induction strategies. A 28 kDa protease detected in the supernatant for strategy 1 by zymography (C). huIFN α2b stability in the supernatant at various pH and in culture broth (D). Lanes 1-7 correspond to pH 2, pH 3, pH 4, pH 5, pH 6, pH 7, pH 8 and lane 8 corresponds to broth culture with protein synthesis inhibitors.

