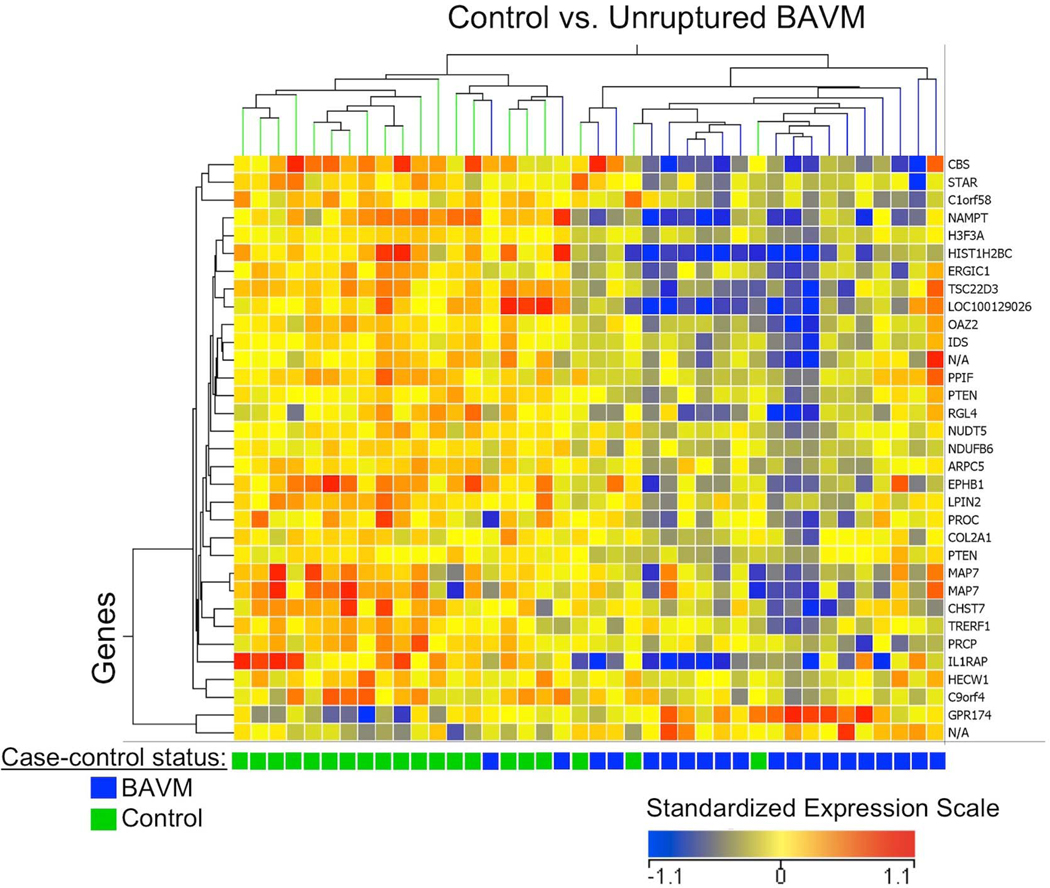
Figure 1.
Hierarchical clustering (gene expression heatmap) of 33 mRNA probesets (29 known genes) differentially expressed (FDR ≤ 0.1, |FC| ≥ 1.2) in the blood of unruptured BAVM patients vs. controls. The x-axis shows each subject (control=green; unruptured BAVM=blue) and y-axis shows individual genes. In the heatmap cells, red indicates high gene expression (i.e. up-regulated expression) relative to the median expression of all probes; blue indicates low expression (i.e. down-regulated expression); and yellow indicates expression is similar to the median. See Supplementary Table 1 for a detailed list of these 33 probesets.

