Figure 2.

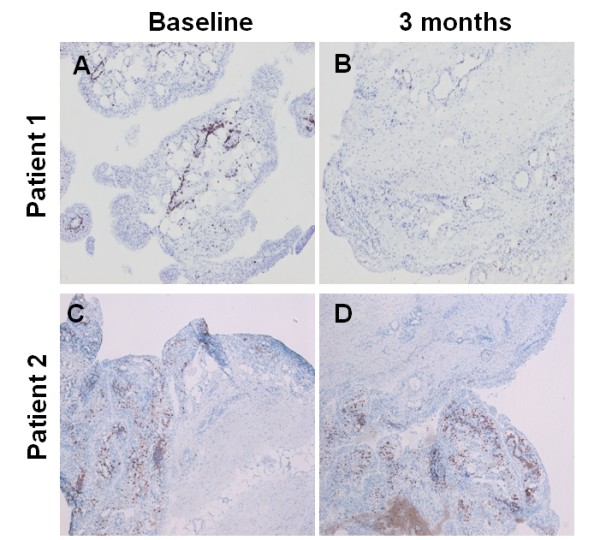
Synovial images showing CD3 expression in a DAS28 moderate responder (Patient 1) and non-responder (Patient 2). A and B are baseline and Week 12 images of Patient 1, and C and D are baseline and Week 12 images of Patient 2 respectively.

Synovial images showing CD3 expression in a DAS28 moderate responder (Patient 1) and non-responder (Patient 2). A and B are baseline and Week 12 images of Patient 1, and C and D are baseline and Week 12 images of Patient 2 respectively.