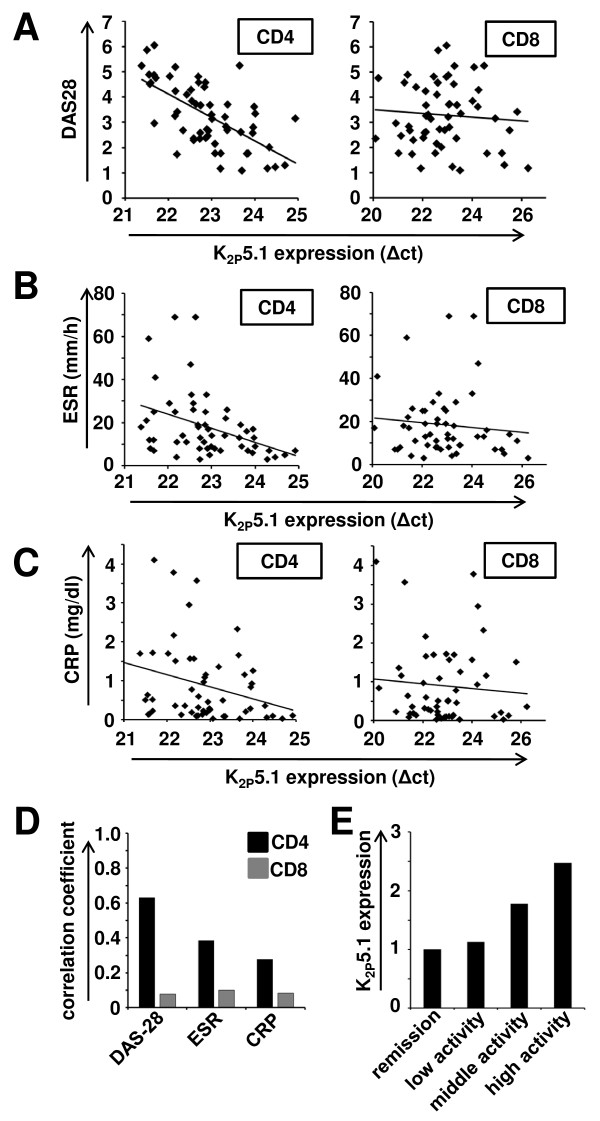
Figure 2.
K2P5.1 expression on CD4+ T lymphocytes correlates with disease activity parameters. A) Expression levels of K2P5.1 (Δct values) and DAS28 scores are shown for 58 individual patients for CD4+ (left side) and CD8+ (right side) T lymphocytes. Note that the x-axis (Δct values) is logarithmic scale and that lower Δct values mean higher gene expression. B) Δct values for K2P5.1 and ESR rates (mm/h) are depicted for CD4+ (left side) and CD8+ (right side) T lymphocytes. C) Δct values for K2P5.1 and CRP levels (mg/dl) are shown for CD4+ (left side) and CD8+ (right side) T lymphocytes. D) The correlation coefficient for K2P5.1 and DAS28, ESR or CRP is shown for CD4+ and CD8+ T lymphocytes. E) K2P5.1 expression levels on CD4+ T cells are shown on clinically defined patient subgroups as stated in the Material and Methods section.

