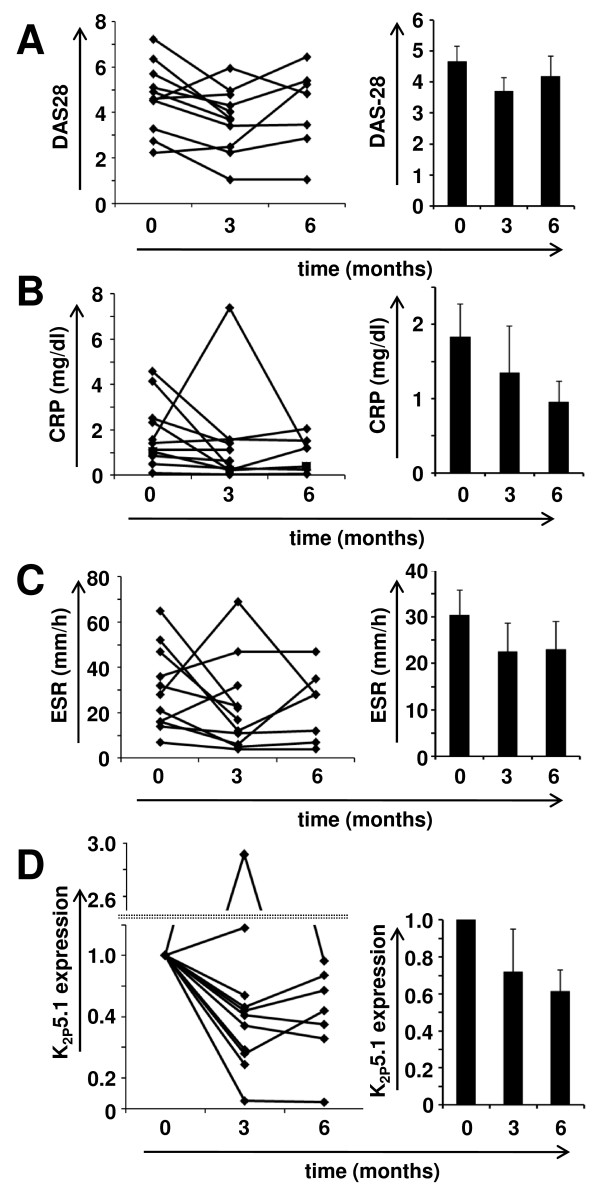
Figure 3.
A longitudinal follow-up study of RA patients undergoing therapy change. Comparison of A) DAS28, B) CRP values, C) ESR values and D) relative K2P5.1 expression levels at therapy change (t = 0), after three months (t = 3) and six months (t = 6) of follow-up. Left panel shows individual values for all patients while mean values ± SEM are depicted on the right side. Note that the y-axis in D) is split for better clarity.

