Figure 1 .
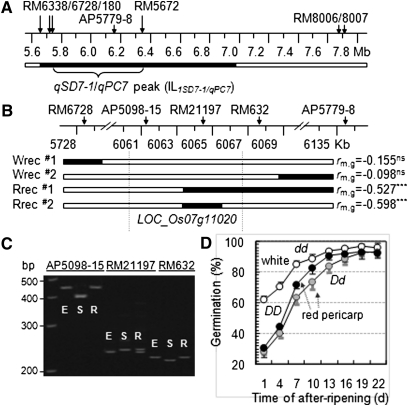
Fine mapping of the qSD7-1/qPC7 region. (A) Physical map of the QTL peak-containing region. ILqSD7-1/qPC7 is the introgression line with only one chromosomal segment from the weedy rice SS18-2 (solid bar) in the background of the cultivated rice EM93-1 (open bars). (B) Graphic representation of recombinants selected for progeny testing. Each recombinant was identified as a plant heterozygous for an SS18-2-derived subsegment (solid bar) and produced white (Wrec) or red (Rrec) pericarp-colored seeds. rm,g is the correlation coefficient between genotypes of the marker on the subsegment and germination values in the recombinant-derived progeny population (see Figure S1 for population pedigree and sizes), with a negative value indicating that the SS18-2-derived allele reduces germination rate and the superscript indicating that the correlation was not significant (ns) or significant at P < 0.0001 (***). Vertical lines delimit the Os07g11020 locus underlying the QTL cluster. (C) Gel image showing marker (AP5098-15, RM21197, and RM632) genotypes of the parental lines EM93-1 (E) and SS18-2 (S) and the recombinant Rrec#2 (R). (D) Genotypic difference in seed dormancy and pericarp color. The duration of dormancy was evaluated by germination of seeds after-ripened for 1–22 d. Data shown are genotypic means (circles) and SD of 15 plants selected from the (B) intragenic recombinant Rrec#2-derived progeny population. The genotypes homozygous for the dormancy-enhancing allele (DD, solid circles) or heterozygous (Dd, shaded circles) at SD7-1 displayed red pericarp color, and the genotype homozygous for the dormancy-reducing allele at SD7-1 exhibited white pericarp color (dd, open circles). Germination profiles for individual after-ripening periods are presented in Figure S2.

