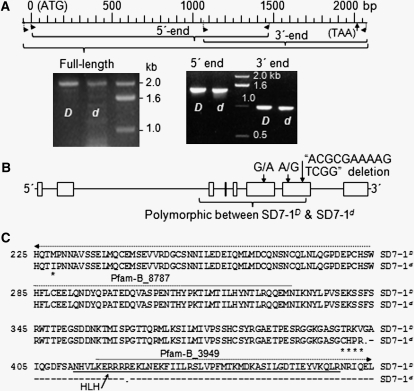
Figure 2 .
cDNAs and allelic variation of the SD7-1 locus. (A) cDNA fragments from SD7-1D and SD7-1d. Images show cDNA clones for the dormancy-enhancing (D) and -reducing (d) alleles. The scale shows positions of the PCR primers and the start (ATG) and stop (TAA) codons on the cDNA sequence of the D allele. (B) Gene structure. Exons (boxes) and introns (line fragments) were predicted by aligning the genomic DNA against the full-length cDNA sequence for the D allele. Arrows indicate variations in cDNA sequence between D and d. (C) Protein sequences. Amino acid sequences were deduced on the basis of the D and d cDNA sequences. Solid/dotted lines indicate the Pfam-A (HLH)/-B matches, respectively, predicted with the Pfam protein family database (Finn et al. 2010) for allele D. Asterisks/dashes indicate changed amino acid residuals located before/after, respectively, the first predicted stop codon (dot) in allele d.

