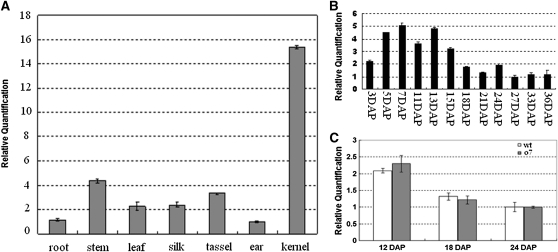
Figure 10 .
Expression analysis of the O7 gene. (A) Real-time qRT–PCR analysis of O7 gene expression in root, stem, leaf, silk, tassel, ear, and kernel (7 DAP). (B) Real-time qRT–PCR analysis of O7 gene expression from 3-DAP to 36-DAP kernels in the W22 background. (C) Real-time qRT–PCR analysis of O7 gene expression in 12-DAP, 18-DAP, and 24-DAP samples from wt and o7 mutant kernels endosperm.

