Figure 5 .
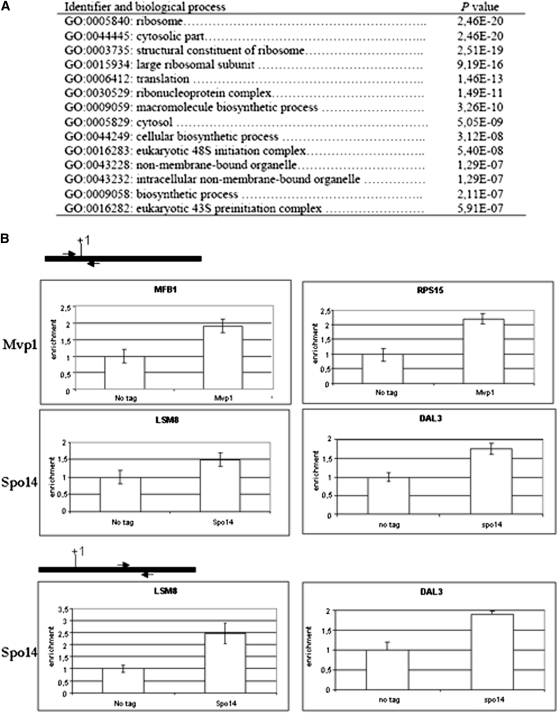
Mvp1 and Spo14 bind RNA pol II-transcribed genes in S. cerevisiae. (A) Summary of GO categories found with the Fatiscan algorithm enriched in ChIP–chip experiments performed with Spo14–LYTAG. (B) Q-PCR ChIP with samples from either the isogenic wild-type strain BY4741 (not tag) or Mvp1–LYTAG and Spo14–LYTAG cells. MBF1 an RPS15 for Mvp1 binding and DAL3 and LSM8 for Spo14 binding were analyzed. The fold enrichment of the indicated gene ChIP samples relative to WCE samples is plotted. Arrows show the position of the oligonucleotides used relative to each gene. +1 corresponds to the first nucleotide of each ORF.

