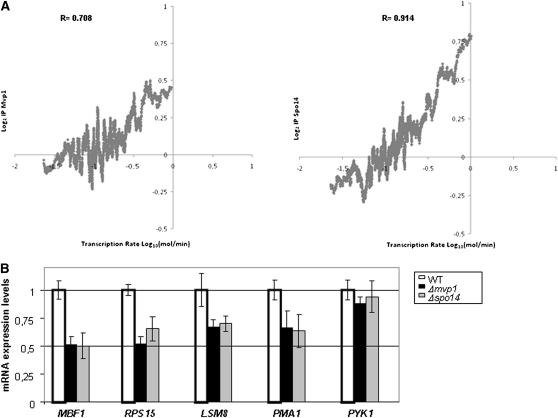
Figure 6 .
Transcriptional analysis. (A) Relationship between the presence of Mvp1 and Spo14 (in Log2 of the immunoprecipitation enrichment) and the nascent transcription rate (in Log10 mRNA molecules/min) (Pelechano et al. 2010). All curves represent the smoothness of the data of IP using the averages values for a sliding window of 100 genes. The population median value for fold change of immunoprecipitate sample vs. whole cell extract has been arbitrarily set to 0. The data represent the merged values of two independent biological replicates. The Pearson correlation for the smoothed data is shown. (B) Quantitative RT–PCR analysis of mRNA levels for MBF1, RPS15, LSM8, PMA1, and PYK1 in Δmvp1 and Δspo14 mutants and in the isogenic wild-type strain BY4741. Each PCR reaction was performed three times to make a representative average with two or three different samples. 18S rRNA and ACT1 were used as normalizers.

